In Today’s Information Era,
data can be collected from anywhere, from mining of twitter feeds to traffic counters. How about video images? They too are data points collected on the wavelength capture by the camera. Implication can be highly versatile but only after developing algorithms that can further quantify the observations in a meaningful insight.
This study explores the effects of genetic mutations in C. Elegans worms, also known as lab worms. With an analysis of video images, mutations effects on the mutant worm’s adaption for higher temperature are characterized in two ways. One way is a change in the responses mechanism, which will further effect the ability to detect a change in temperature. Second classification is in the physiological mechanism and reduces the ability of organs to exhibit normal behaviour at high temperatures.
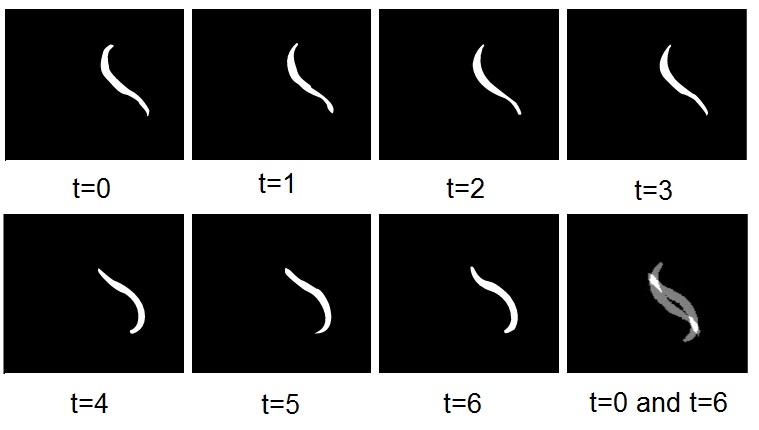
59 mutations at different chromosome locations were studied. The behaviour of the mutant worms were recorded in 80 second videos. The contrast was adjusted so the changes in the coloration of the pixel can be counted by a software. The number of pixels that changed colour in between frames tell us how much movement was exhibited by the lab worms during the process of increasing temperatures (figure 1).

A mutation in the physiological mechanism resulted in a gradual decrease in movement and ending in paralysis. On the other hand, a mutation in the response mechanism can be seen as a rapid decrease in movement to paralysis as the lab worms will not change their swimming behaviours until it is too late. Figure 2 shows the hypothesized thermal performance curves.

27 videos of different worms were recorded as the sample size and accuracy in determining the true effects of the mutations. The resulting data-set was still very noisy and contained many outliers. Simple statistical summaries and methods could not conclude what was happening. Our solution was Functional Data Analysis (FDA) that was available as an R package. FDA was able to solve our problem by looking at the observations as a continuum over time. A polynomial function was plotted for intervals and the polynomials were connected to create a smooth continuum.
The next step in quantification was to numerically determine the rates of decrease by calculating the derivative of the thermal performance curves. Linking back to our initial hypothesis, a gradual decrease in movement can be seen by a constant derivation and a spontaneous paralysis will result in rapid change in the derivation (figure 3).

Clustering was used to group the 59 strains into two buckets of classification. There were many strains that did not completely match the hypothesis, which was expected as most mutations do not exclusively affect just one mechanism. However for those strains that behaved accordingly, results of the analysis are similar to the expectation of our initial hypothesis (figure 4).

Although the videos were limited to black and white, the data was big due to the multiplicity of working with pixelated information. In order to separate the information from the noise we needed to use powerful smoothing methods, such as the FDA. We also considered Functional Principal Component Analysis (FPCA), which was more powerful but the FDA procedure was significant enough. Considerations into quantification of colour image will require a powerful algorithm that mines the elementary data generated by the charge coupled device.