No matter where you go
you will always find someone performing some sort of analysis. This is no surprise since it is only human nature to question why an event has occurred and what caused it to happen. As we gain a better understanding of the cause and effect, we can better prevent a bad thing from happening or predict the chances of a positive gain.
Because analysis of trends has became popular in all most every industry, mathematicians and statisticians came together to develop a set of procedures for quantifying results, analyzing data and predicting the future. The big idea was that when something happens to x (independent variable), this cause a change in y (dependent variable) and by systematically analyzing the change in one variable relative to another we can use our observations to predict the outcome of a situation. The set of procedures used to measure the correlation between variables is called regression analysis.
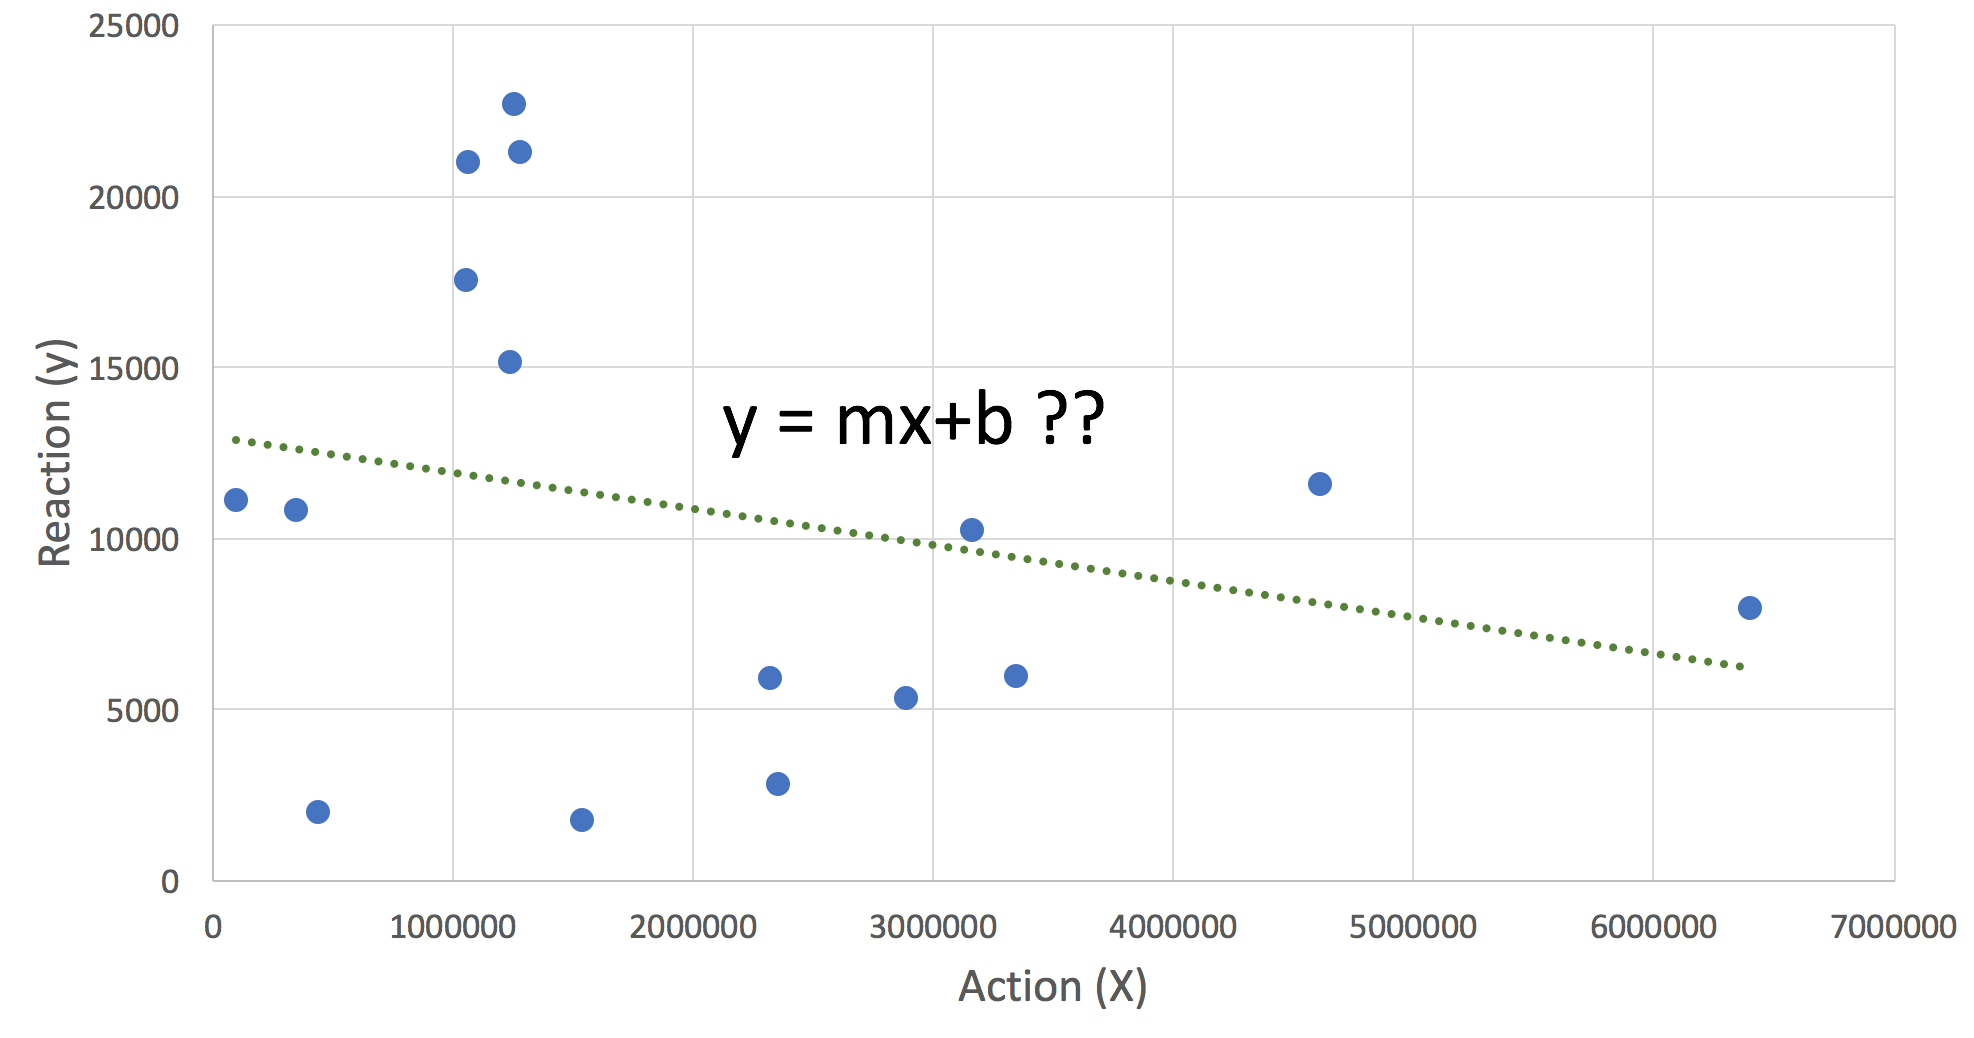
Regression analysis can take on many forms and names depending on the data you want model and how complex you want analysis to be. Most of you have done a simple one variable linear regression known as the linear line of best fit (does y=mx+b ring any bells)? On the other end of the spectrum, regression has no limits on the type of data it can model, which makes it so powerful. Some examples of advanced regression modelling includes logistic model, multivariate, time series and hazards models. They all do the same task of finding correlation in the data and minimizing error in predictions.

At this moment, you might be wondering if regression is some kind of black box magic that takes an input and splits out an outcome that we are supposed to trust. The answer is Yes and No. In simple language regression takes two types of variables, a dependent variable (y, the effect) and a set independent variables (x, the cause); and performs a series of calculations to predict the correlation by minimizing the level of random error. An example we can use is the weather, we have general idea of how cold it will be tomorrow based on the temperature of today. If we were to record the temperature every day, then we have enough data to estimate that the temperature will drop by one degree every few days. However, for temperatures during a storm we will need take into consideration that it might be much colder one day and warmer the next. While a regression model will consider this as a random error. If we had more data on temperatures during storms we can add this variable into the analysis as well. When we add more variables in the model, regression can seem more like black box magic since the number of calculations the program performs exponentially increases to the point where it’s hard for the human mind to comprehend, let alone do manually.

Because regression looks at every data point and it’s relation with other metrics without any knowledge of the background, often a skilled statistician or data scientist is needed to monitor the analysis to ensure a cleaned dataset is being fed into the program and adjustments are made such that the model matches the nature of the industry. For those that work in digital marketing, that means restrictions on the model so matches the logic with in the digital landscape. Below are some questions a statistician performing regression might ask,
- Is my data bias in anyway?
- What are the main KPIs and what are the secondary KPIs?
- Are there any relation between the KPIs? Such as clicks and sessions.
- Are there any boundaries and limitations the model needs to know about the data?
In conclusion, regression is the general term for describing the statistical procedure for analyzing trends. Often when performing predictive analysis or forecasting, you might not recognize that you are performing regression analysis since it can quickly transform and certain models are used so often that they have adapted their own name. I was once told by an expert in data that there is only 2 questions an analyst needs to answer, (1) what is the current state? And (2) what are the trends? The current state is described by reporting (Totals, Average and Medians), whereas the story of trends is told by regression.